
Getting Started
with
Panoramic View
Panoramic View displays TC proprietary scores of any financial instrument. TC proprietary scores can be used in watchlists, screener pages and portfolios.
schedule
3
min
Panoramic View consists of three powerful indicators, providing a summary across multiple analysis types including technical, fundamental, sentiment and news. Together, these analytics offer a panoramic view of financial performance.
How is the price trending on the charts?
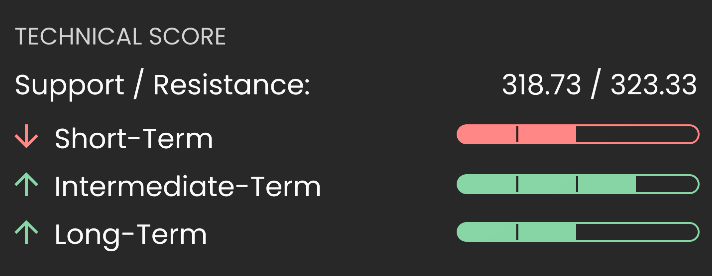
Using the Technical Score investors can easily identify the directional outlook of a financial instrument as either bullish, bearish or neutral across short to long time frames.
How does the company compare within its industry context?
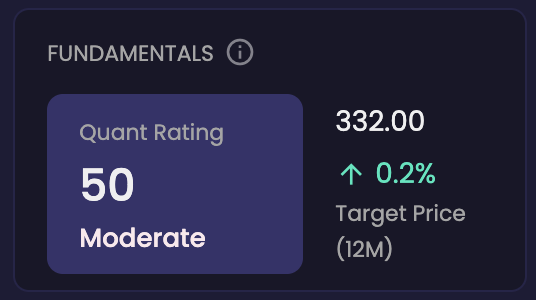
The TC Quantamental Rating combines Growth, Value, Income, Quality and Momentum into a 0–100 assessment. The 12-month TC Target Price translates that rating, recent price volatility and the latest closing price into a forward-looking price benchmark.
What’s buzzing in the news and on social media?
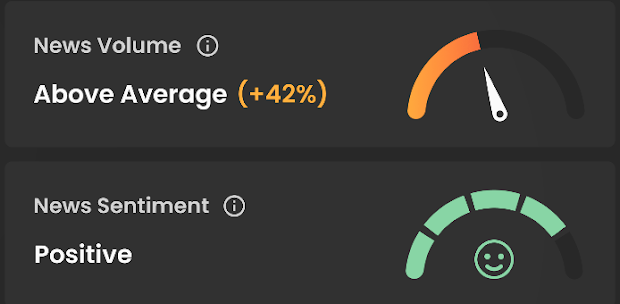
These indicators show how much news attention an instrument has been getting in the last 24 hours, along with the overall news sentiment as positive or negative. The higher the News Volume gauge, the more of an impact this positive, or negative news could have on the market.
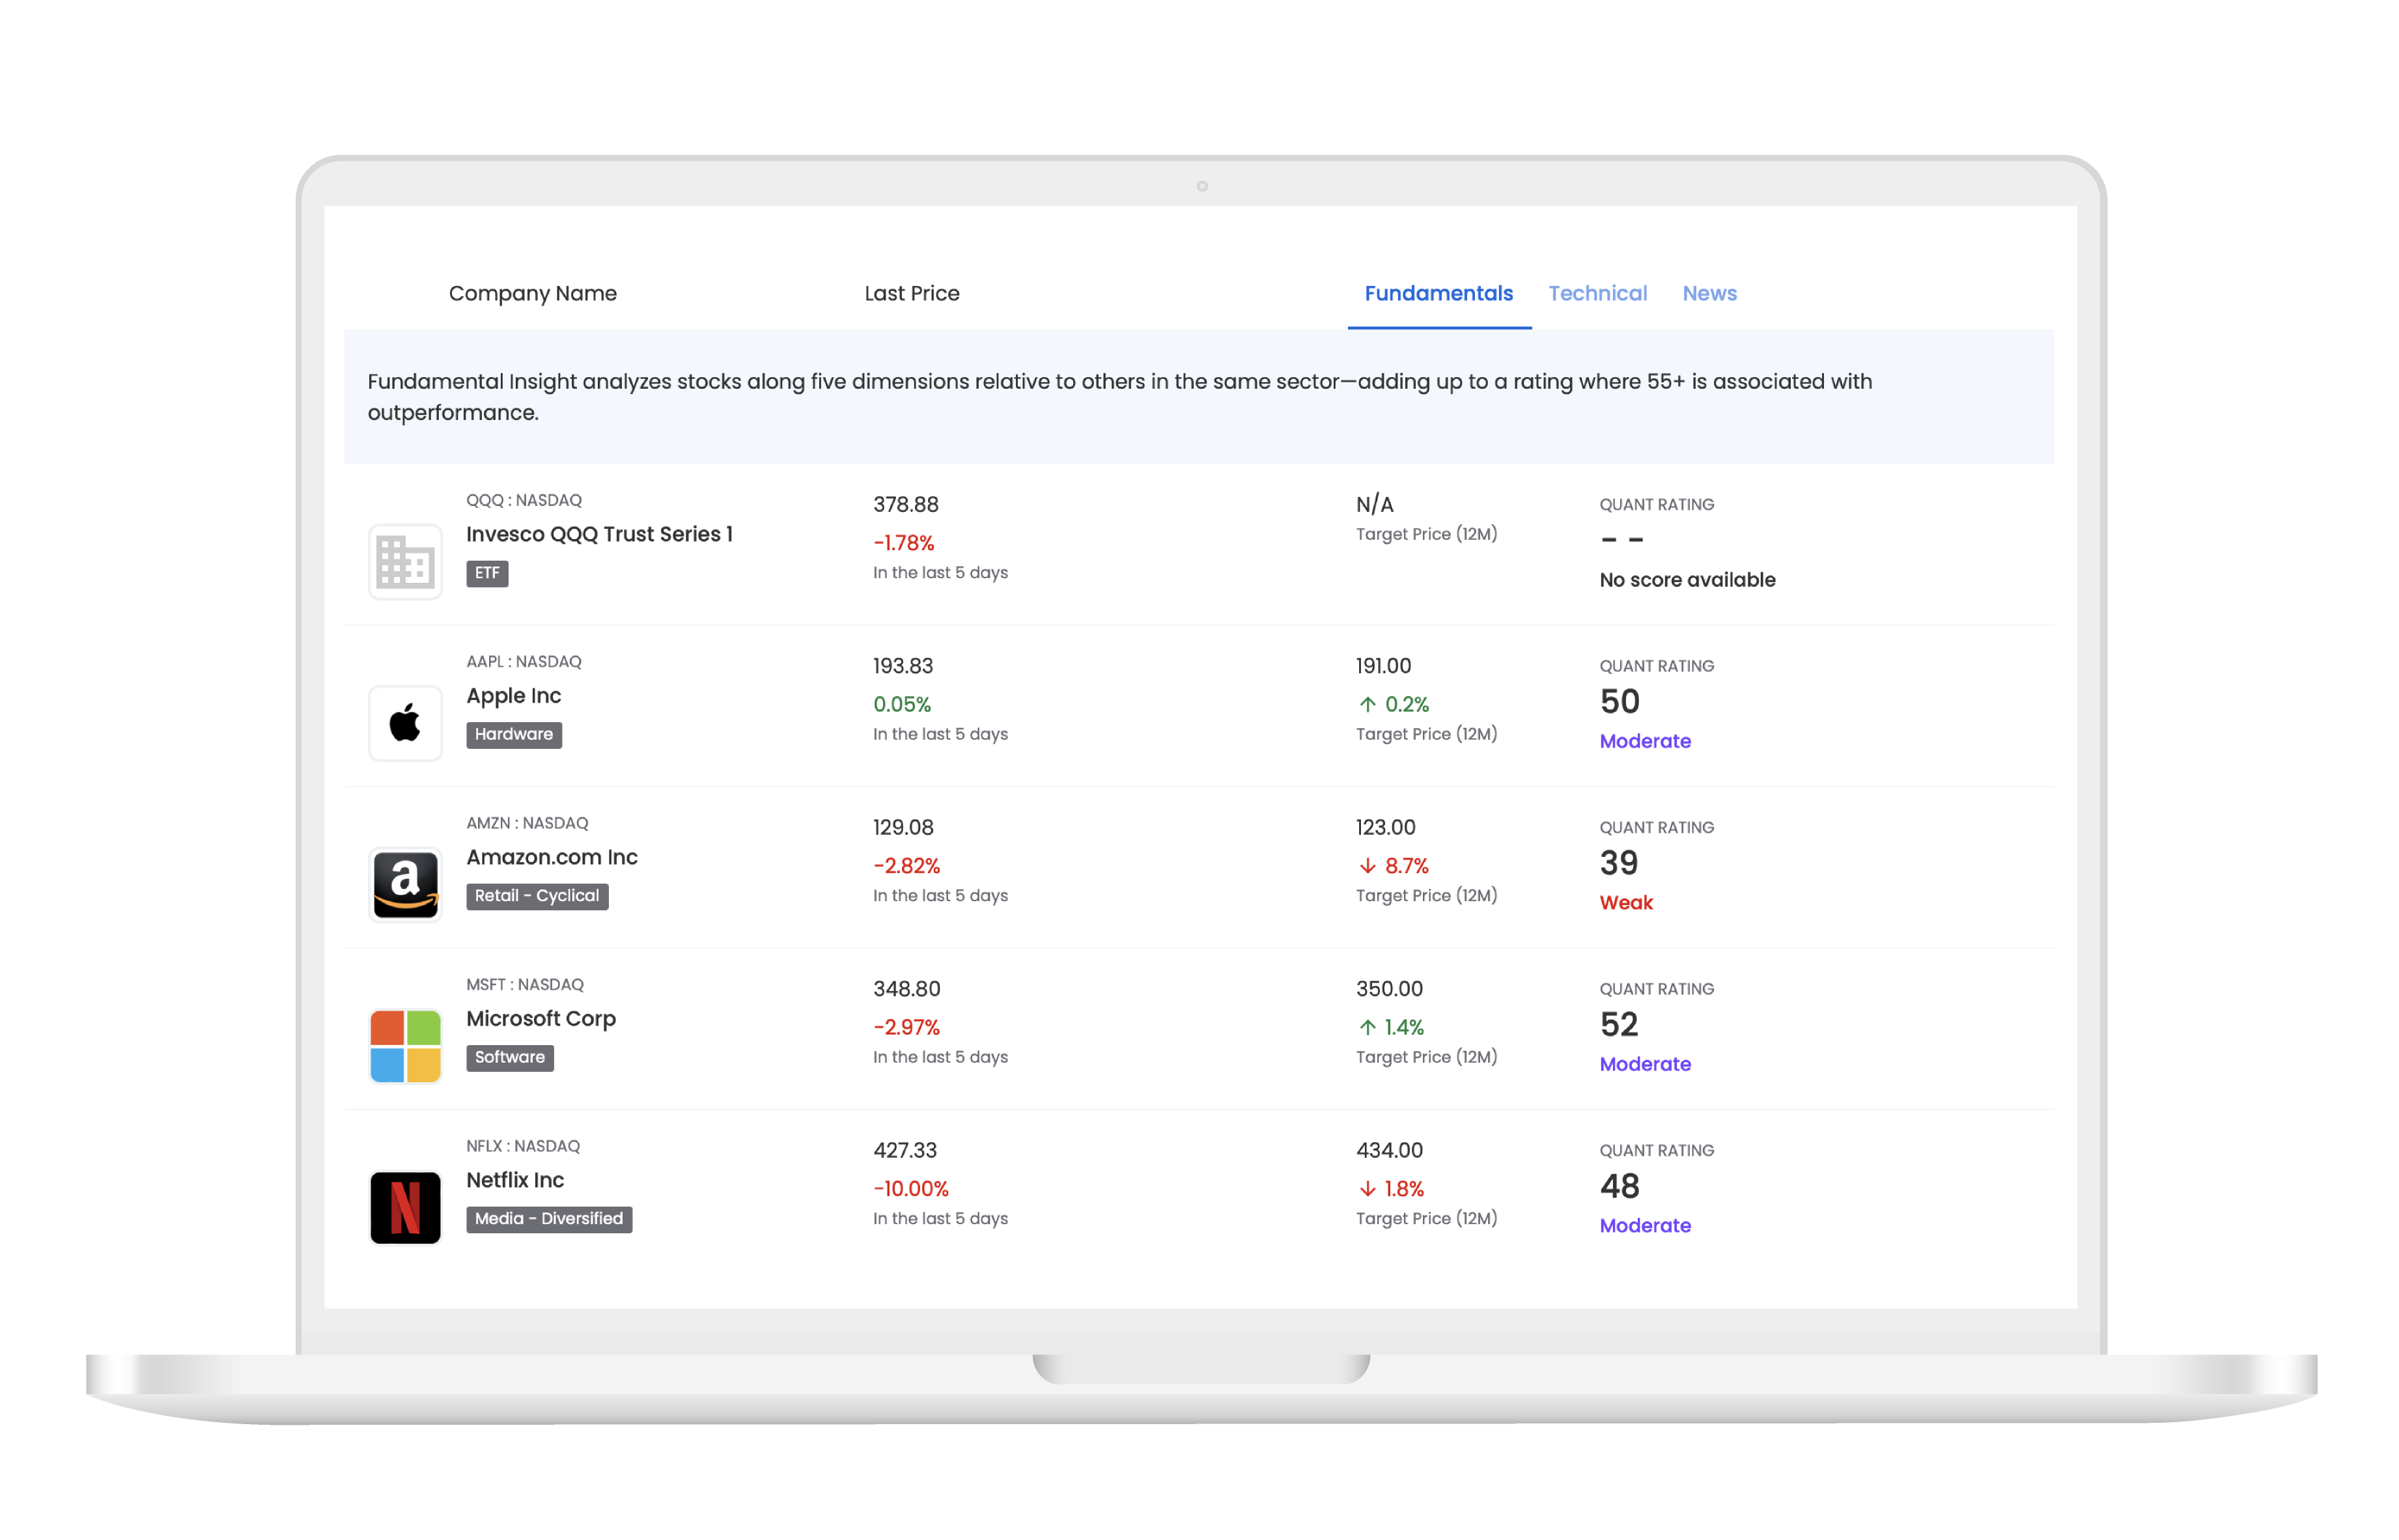
Easily view key data points about an instrument, including its ticker symbol, related-industry, market price, and overall price change in the last 5 days.
.png)
Our award-winning portfolio of insightful analytics enable today's investors to find and validate new opportunities, monitor markets, learn about finance and manage their risk.
Discover Trading Central


