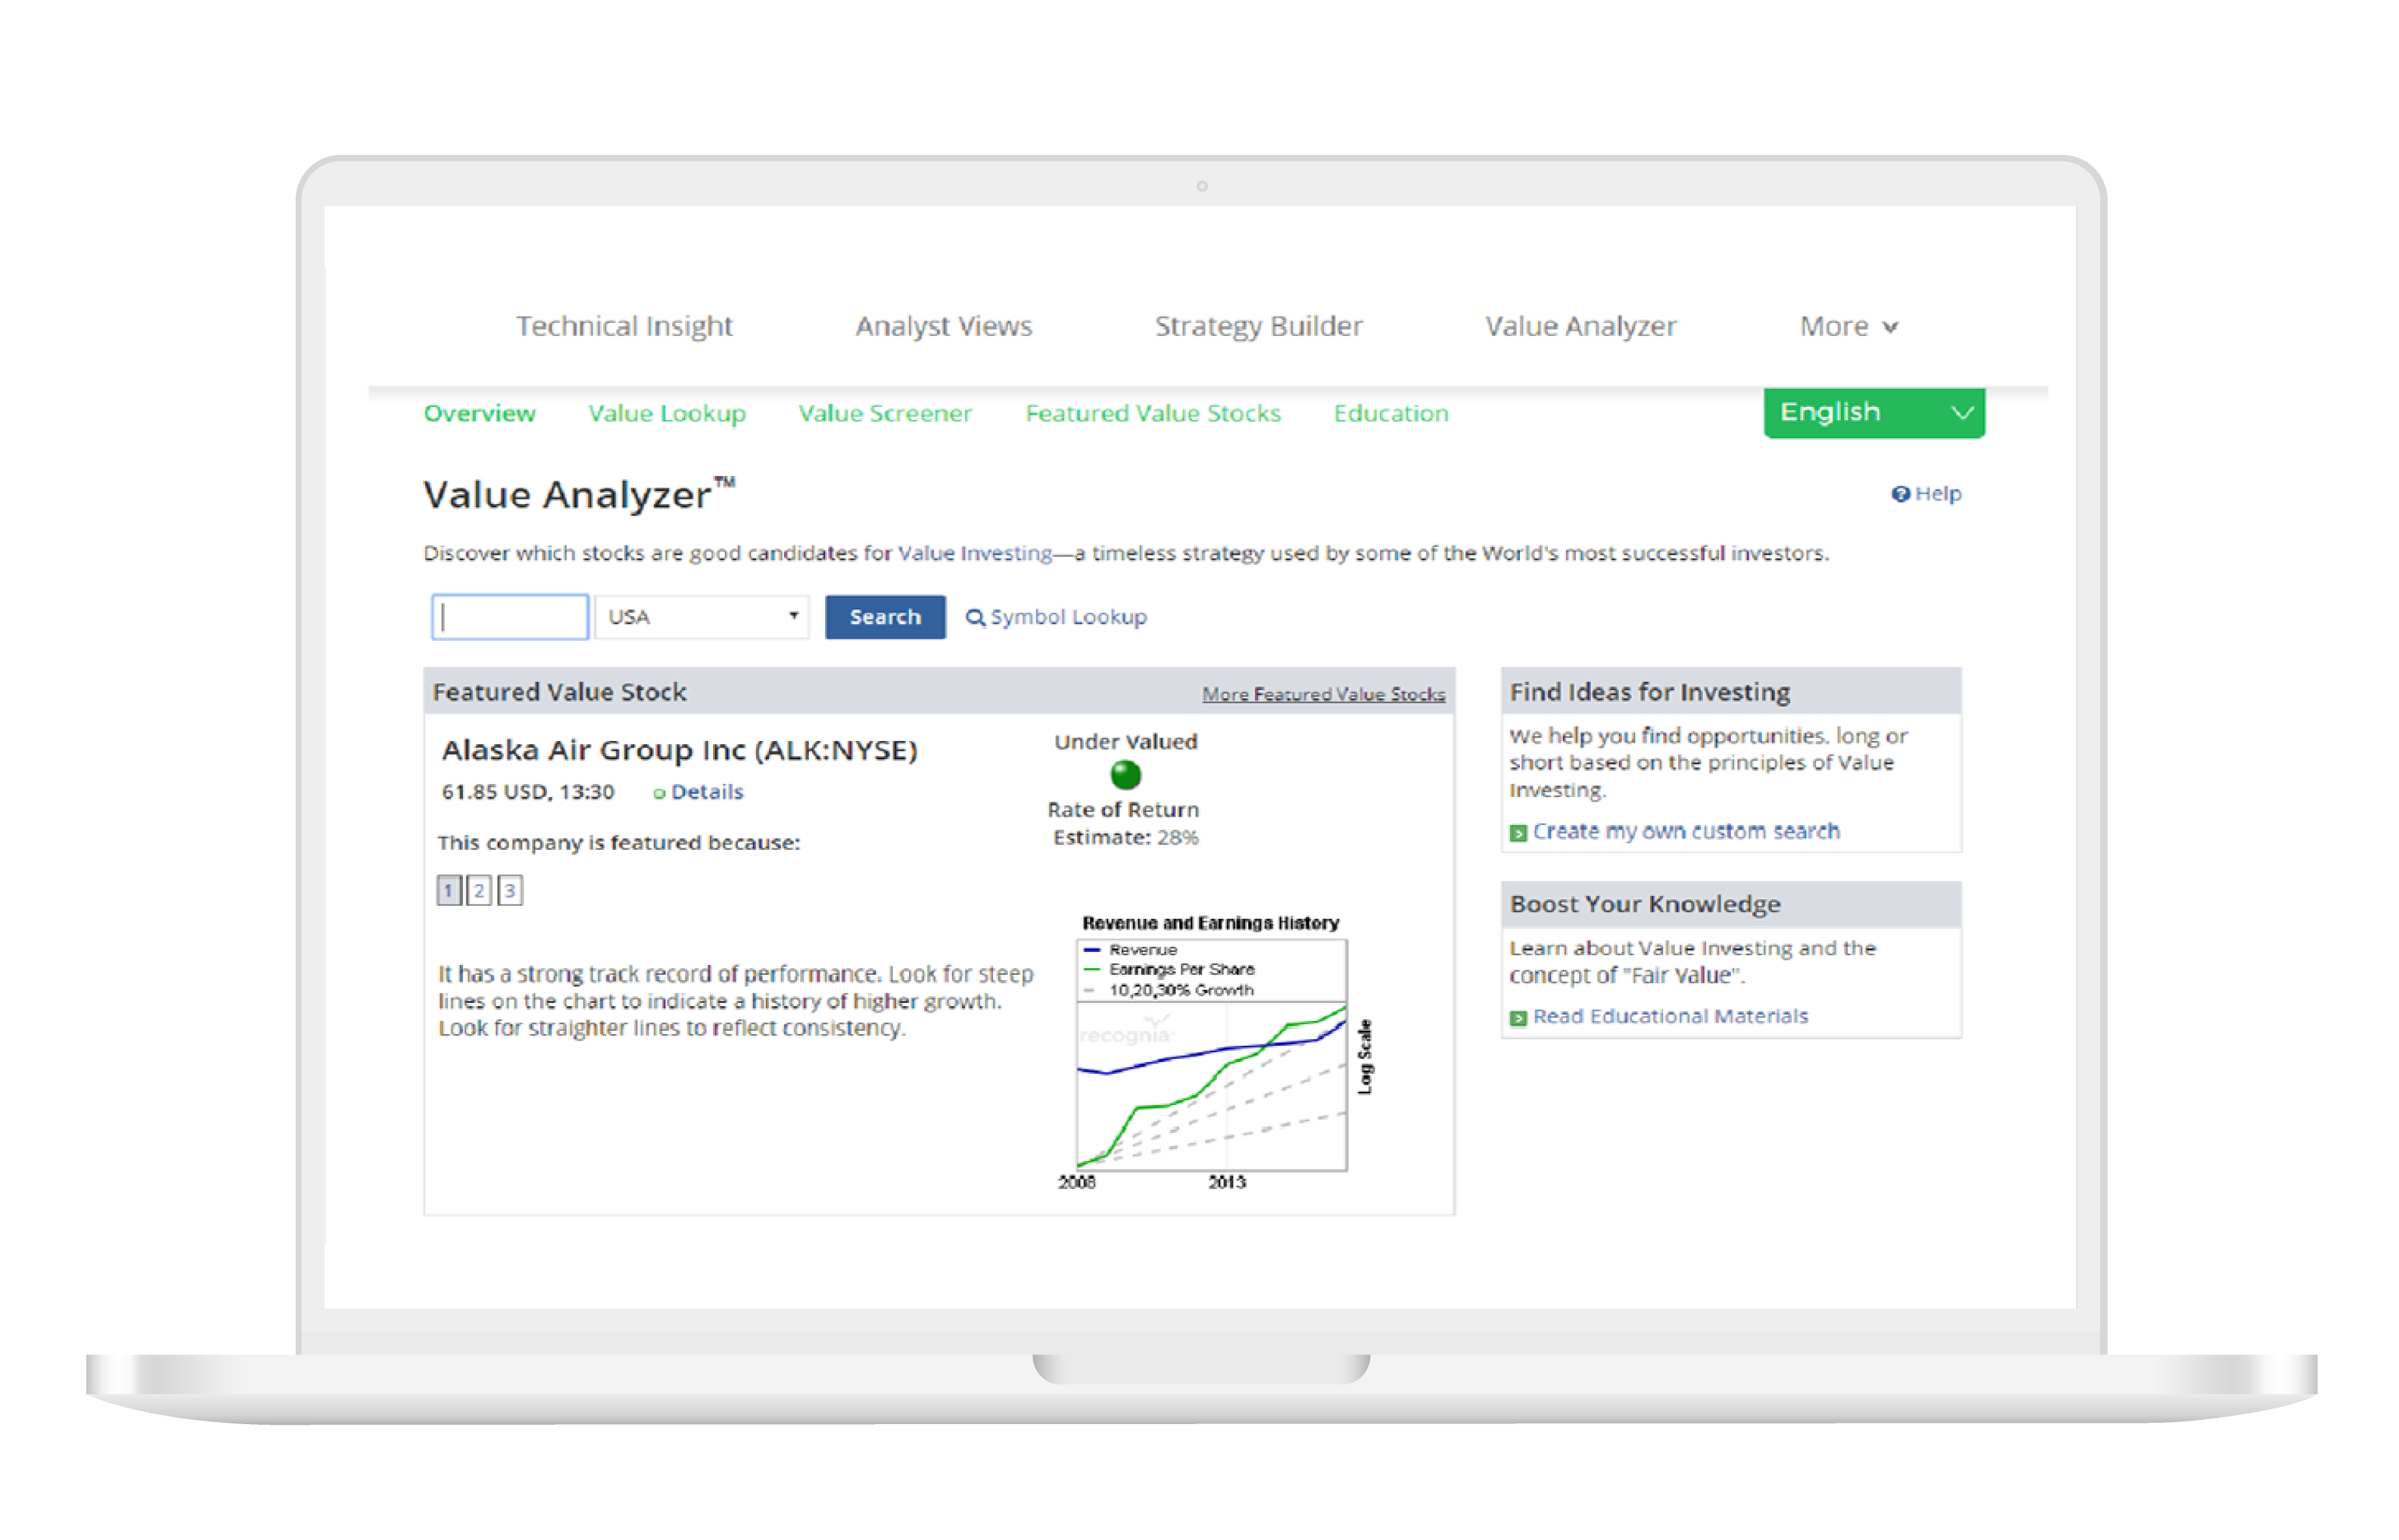
Education
/
Value Analyzer

Discover

Value Analyzer

Learn waht is TC Value analyzer

Discover fair valued investments.

Value Analyzer helps you to remove the emotional aspect of investing to find fair valued opportunities. It provides a simple, intuitive view of all key value metrics of a particular stock on one page, making it easy to see the full picture and make confident trade decisions. The easy traffic light provides a concise summary of how the stock's revenue/earnings history, outstanding shares, dividend yield and more, while the forecasting tools enables you to explore how potential growth assumptions alter the analysis.

Learn from the Experts

Trading Central's global research team are here to help you harness the power of products! In the market updates below, our expert analysts use Technical Insight to find new opportunities!

Frequently asked questions.

In the results table, where is the traffic light and estimated Rate of Return?

The traffic light and estimated Rate of Return are not included in the results table, but you can find them by clicking on the Value Lookup link where you can then see a complete value analysis on a particular stock. They aren't included within the results table because it is not necessary in most cases. Most people search for undervalued stocks, in which case all stocks returned would be green lights. If you were to change your search to look for overvalued stocks, all those stocks would be red lights. If you search for fairly valued stocks, those would be yellow lights. The stocks are sorted to float the MOST undervalued stocks to the top, meaning those stocks where the price is furthest below the fair value line on the value chart.

Why are there no values on the axis of the Revenue & Earnings history chart?

This chart shows an investor two critical pieces of information regarding the Revenue (Rev) and Earnings per share (EPS) of a company: what the growth rate is, and what the consistency of that growth is. On a logarithmic chart, the growth rate is shown by the steepness of the lines, and the consistency is shown by their straightness. The quality of the lines is what's important for this analysis, not the actual values. The actual values can be referenced in the data tables at the bottom of the page when you look up the report on a particular stock. In general, value investors like to hold companies with very straight and fairly steep lines, which means a company has a long history of consistent top and bottom line growth. Lines that are choppy, or trending downward, are considered negative attributes of company performance.

What does the Earnings/Growth (%) column tell me?

This is the Estimated Earnings per Share (EPS) growth rate. Estimates are based on performance. Higher growth reflects good fiscal management and is generally better, exponentially due to the compounding effect on stock price over the years. But keep in mind that very high rates of growth, above 30%, are difficult to sustain for longer than a few years. You can see actual EPS figures in the data table at the bottom of the page when you pull up the report on a particular stock.

What does the Revenue/Growth (%) column tell me?

This is the Estimated Revenue growth rate. Estimates are based on past performance. Growing revenue is clear evidence of a viable business. You can see actual revenue figures in the data table at the bottom of the page when you pull up the report on a particular stock.

What does the Rate of Return % number mean?

This number represents the projected average annual return you might expect after purchasing shares in the company and holding them over the default time horizon of 5 years, based on the EPS growth rate that we have projected. When you pull up the analysis on a given stock, you can click on the value chart to launch the projector tool, and model other timeframes and growth scenarios to see how it affects the Estimated Rate of Return.

How do I search for companies with a green traffic light and high estimated Rate of Return?

To search for companies with a green traffic light, set the Valuation field to Under Valued. This is the default. The Rate of Return field is not yet available for screening. When you see the result table, click on the Value Lookup link for a particular stock to find out its Estimated Rate of Return which appears below the traffic light.

Didn't find what you were looking for?