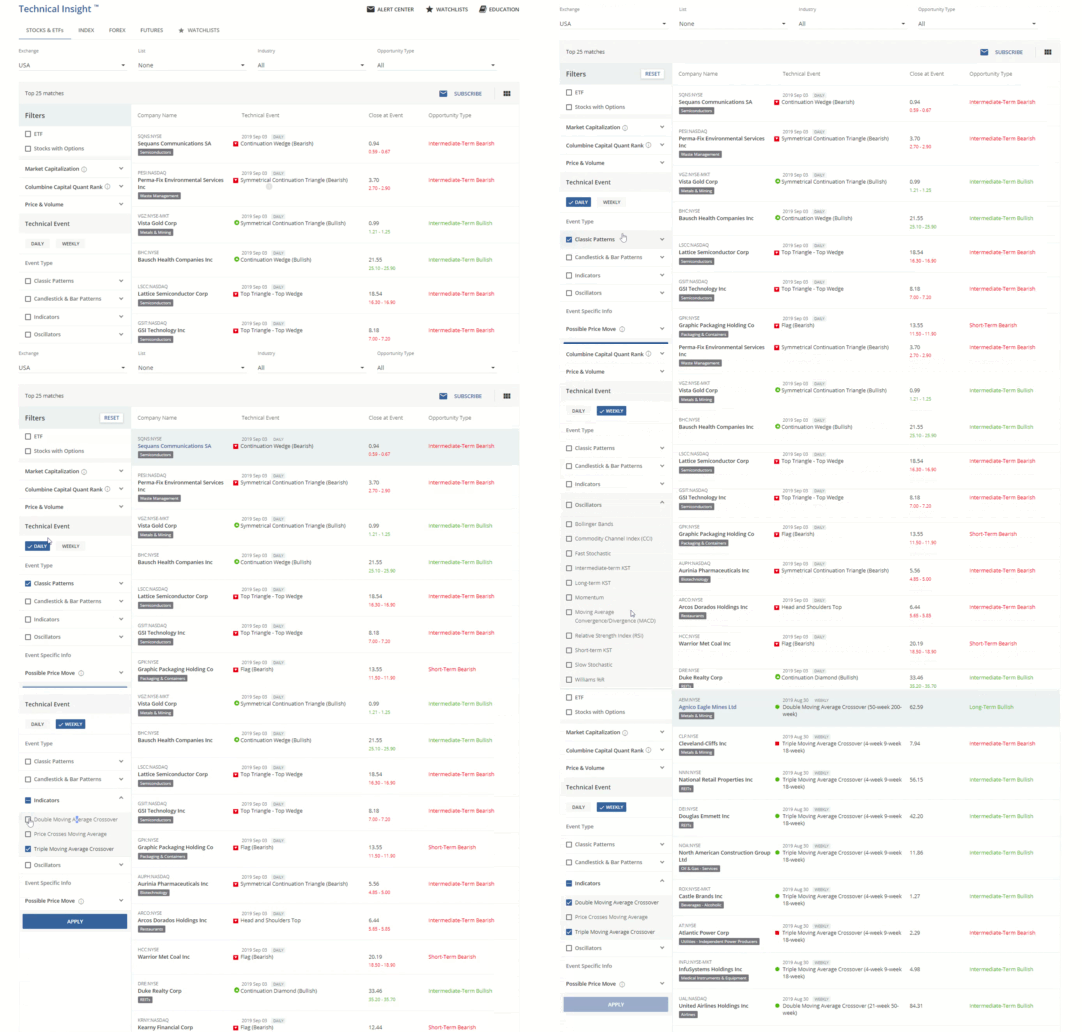


Using Technical Insight you have the option to explore the following instruments: Stocks & ETFs, Index, Forex or Futures. Hit subscribe to get new investment opportunities sent straight to your email address.

This list shows the financial instruments that have recently formed a Technical Event. A Technical Event represents a significant occurrence based on our price chart analysis. In the example below you can see stock options that have formed different patterns such as a bullish Flag, a Diamond Bottom and a Symmetrical Continuation Triangle.
.png)
The Opportunity Type Column shows whether the Technical Event was found as a sign of strength or weakness. In other words, are we seeing signs of a bullish or bearish movement. Switch to a chart view by click in the upper right corner.

Common filters across the top of your screen include filtering by Exchange, List, Industry, or Opportunity Type.

These filters include searching for only stocks or only ETFs. Alternatively, filter for stocks in a specific price range as some investors may not want to include options such as penny stocks. Investors can also use the TC Quantamental Rating to filter for higher quality stocks. The options are endless!

You have the option of choosing daily or weekly charts. Meanwhile, Technical Insight offers a variety of Event Types including Classic Patterns, Candlestick & Bar Patterns, Indicators and Oscillators. Keep your search broad by filtering for all Classic Chart Patterns or get specific by choosing a certain pattern that matches your needs.

Hit the subscribe button so you can save your criteria to the alert center. This means you can find your saved criteria in the latest results and get new matching opportunities sent directly to your inbox.

Using Technical Insight you have the option to explore the following instruments: Stocks & ETFs, Index, Forex or Futures. Hit subscribe to get new investment opportunities sent straight to your email address.

This list shows the financial instruments that have recently formed a Technical Event. A Technical Event represents a significant occurrence based on our price chart analysis. In the example below you can see stock options that have formed different patterns such as a bullish Flag, a Diamond Bottom and a Symmetrical Continuation Triangle.
.png)
The Opportunity Type Column shows whether the Technical Event was found as a sign of strength or weakness. In other words, are we seeing signs of a bullish or bearish movement. Switch to a chart view by click in the upper right corner.

Common filters across the top of your screen include filtering by Exchange, List, Industry, or Opportunity Type.

These filters include searching for only stocks or only ETFs. Alternatively, filter for stocks in a specific price range as some investors may not want to include options such as penny stocks. Investors can also use the TC Quantamental Rating to filter for higher quality stocks. The options are endless!

You have the option of choosing daily or weekly charts. Meanwhile, Technical Insight offers a variety of Event Types including Classic Patterns, Candlestick & Bar Patterns, Indicators and Oscillators. Keep your search broad by filtering for all Classic Chart Patterns or get specific by choosing a certain pattern that matches your needs.

Hit the subscribe button so you can save your criteria to the alert center. This means you can find your saved criteria in the latest results and get new matching opportunities sent directly to your inbox.

Our award-winning portfolio of insightful analytics enable today's investors to find and validate new opportunities, monitor markets, learn about finance and manage their risk.
Discover Trading Central